
Architecture#
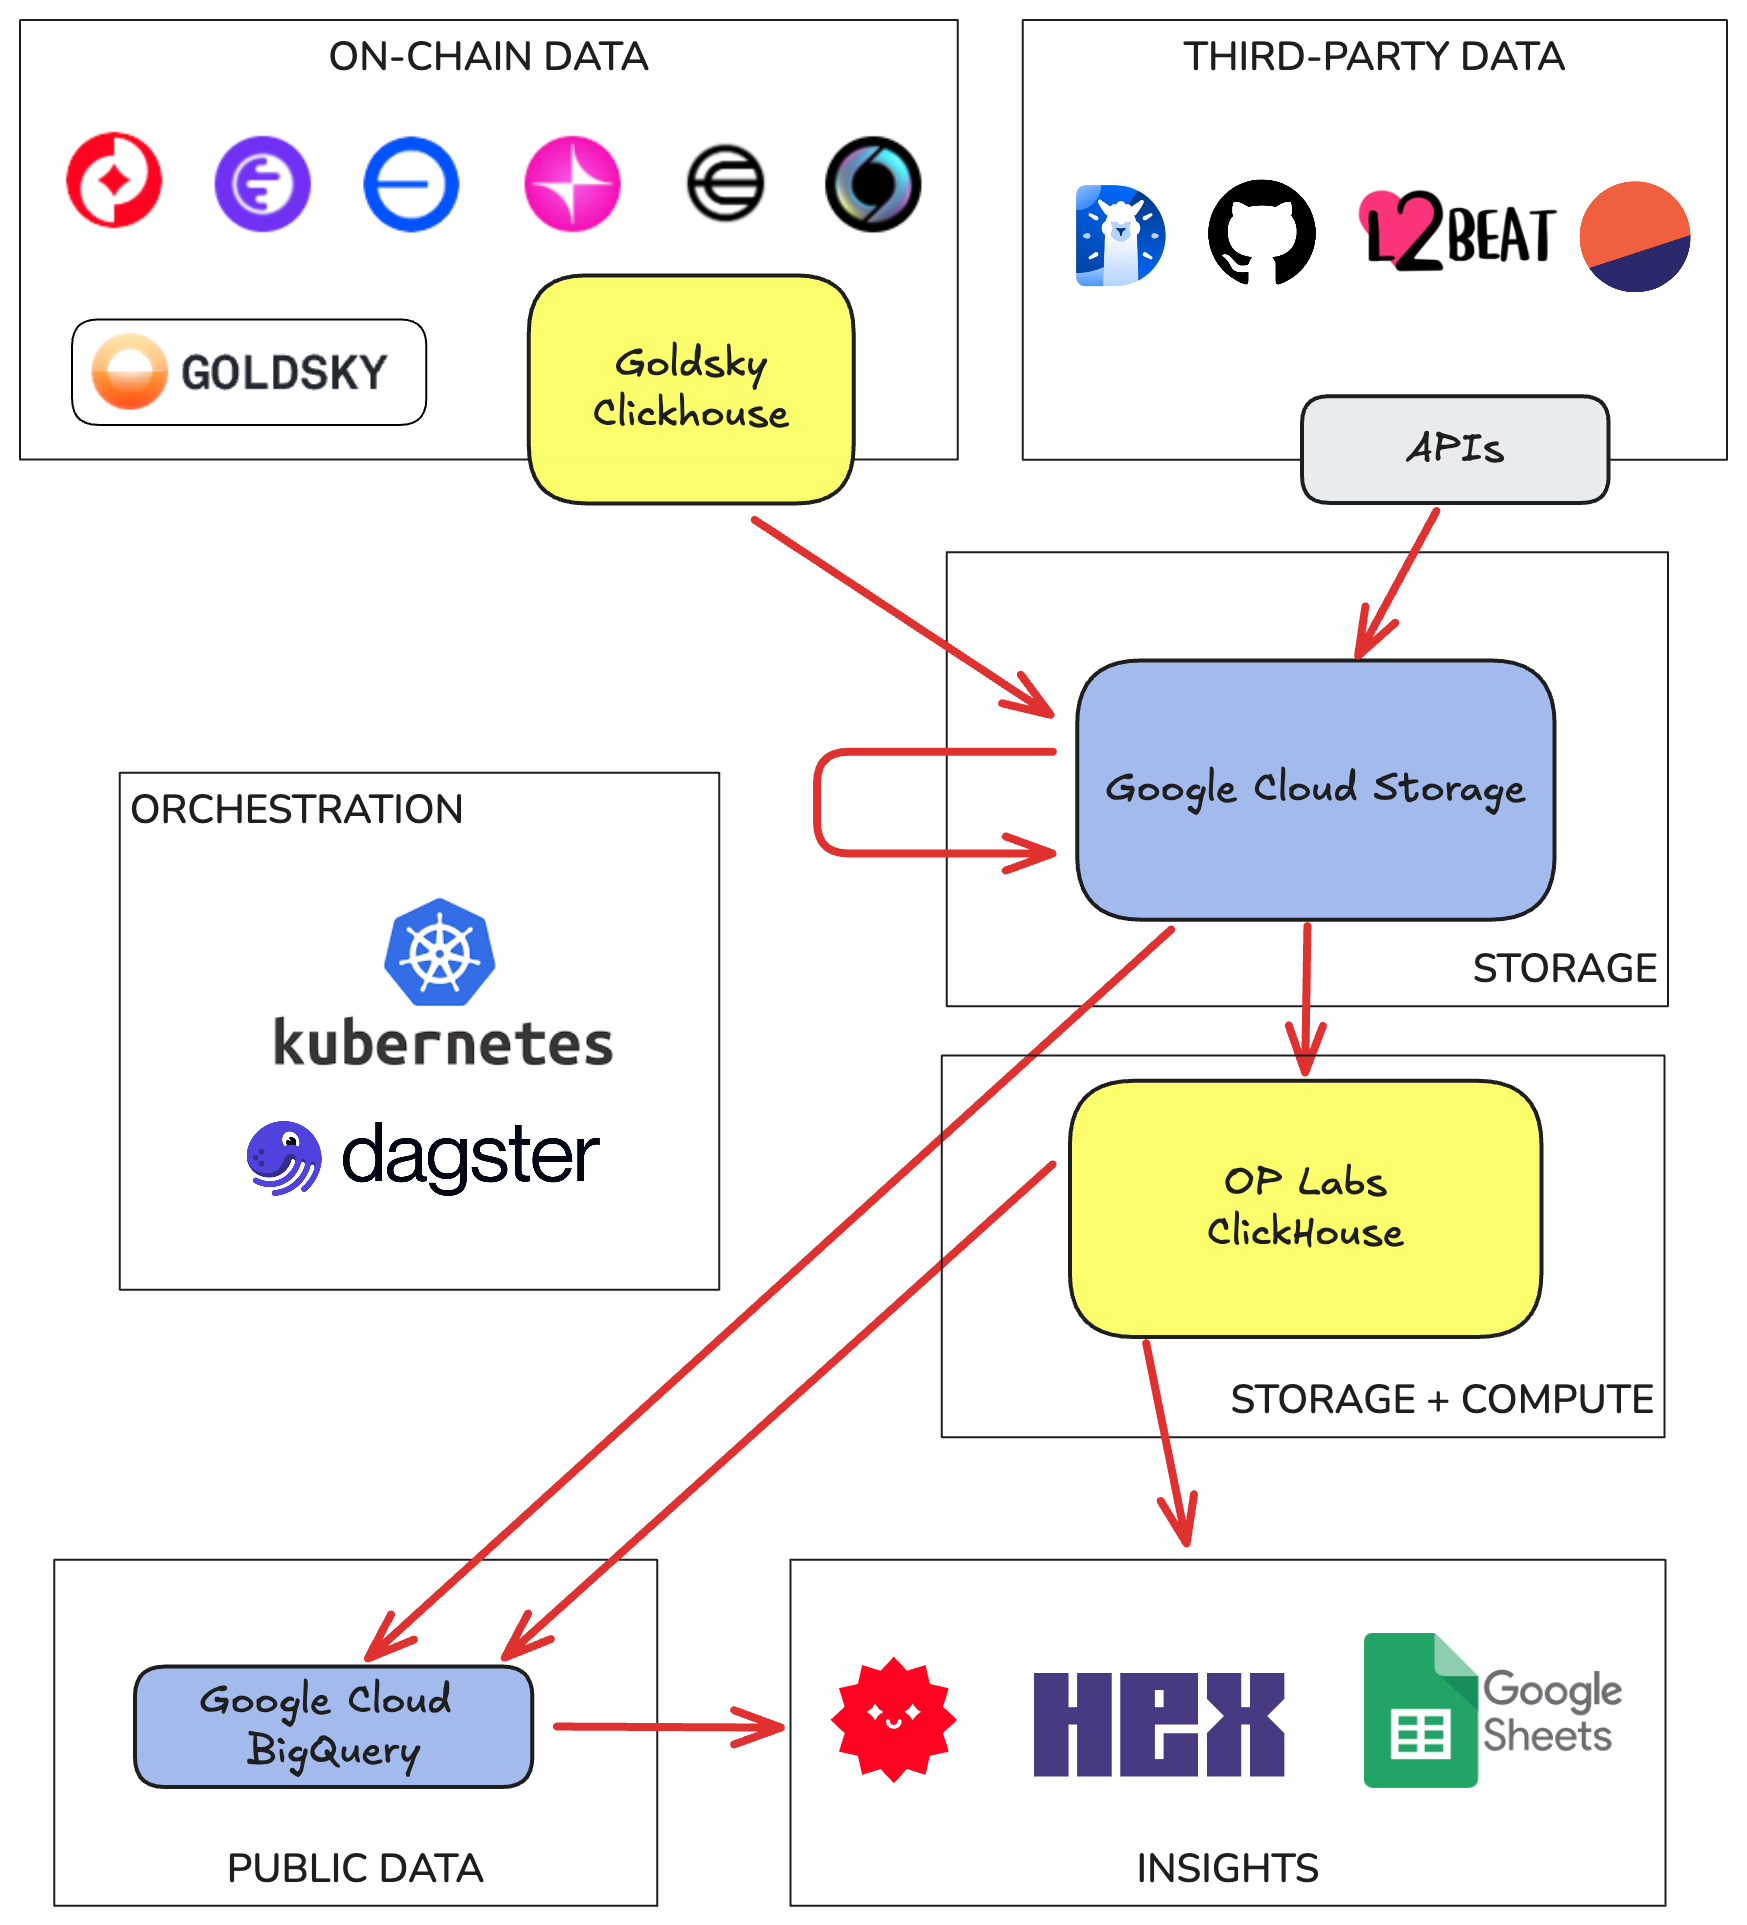
The diagram below shows the high level architecture of the OP Labs Data Platform.
Ingestion#
We ingest raw-onchain data from Goldsky, using a Goldsky-owned ClickHouse instance as the data interface.
We also ingest data from numerous third-party sources. Primarily from API endpoints, but also by other means (public gcs buckets, reading onchain contracts, etc).
Storage#
Our primary storage layer is Google Cloud Storage (GCS). All of the data we ingest is first stored in GCS before any further processing.
We use a single GCS bucket for all data, with the following naming convention:
gs://BUCKET/ROOT_PATH/partitionA=0/partitionB=1/file.parquet
The ROOT_PATH of a dataset is almost like a table name. It can be nested, so we can group related
datasets together in a hierarchy.
The most common partition used is dt (for date). We use it in almost all our datasets as we
generally stick to daily data processing. For multichain datasets we also use the chain partition.
The file format used is always Parquet.
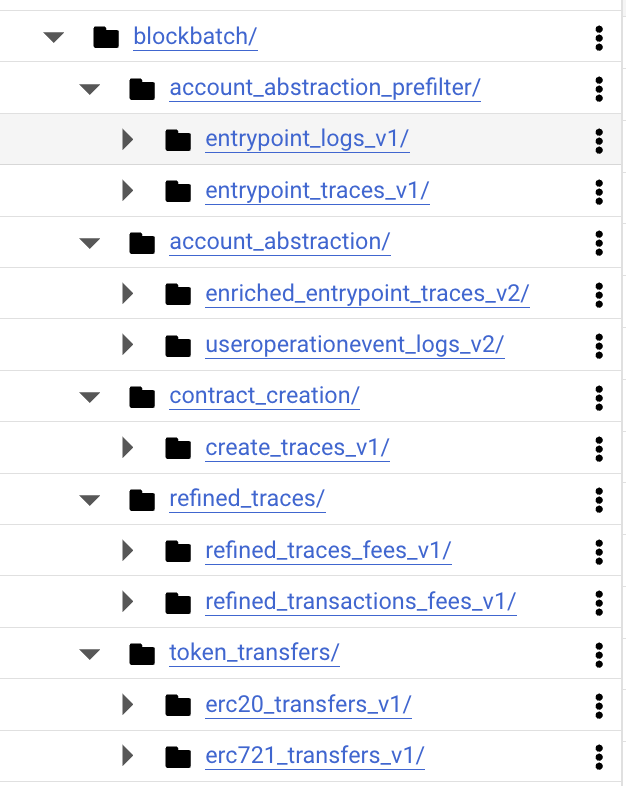
Below we show some example root paths in GCS. These paths are for a family of tables called
blockbatch (for the approach used to process them). As you can see we have multiple levels of
neseting:
ClickHouse Data Warehouse#
We use ClickHouse as our data warehouse. From ClickHouse we can use the S3 Table Engine to read data directly from GCS. We have a number of convenience functions that let us read by specifying the root path of the data in GCS and a partition value.
Processing and Orchestration#
We use dagster running on kubernetes to orchestrate ingestion and processing of data. This includes:
Ingestion, which reads from our input data sources and writes to GCS.
Processing, which reads from GCS and writes back to GCS.
Transformations, which runs on the ClickHouse Data Warehouse.
Exports, which read from GCS or ClickHouse and write to BigQuery. We use this for public tables and also to expose data to insight toosl that cannot read from ClickHouse directly.
Insights#
We use a number of tools to help us create dashboards and reports. Our main tool is Hex but we also use Streamlit and Google Sheets.